Microsoft Excel Tricks That Will Change the Way You Work
Are you tired of spending lots of time organizing your data in Excel? Do you feel like you’re constantly struggling to find what you’re looking for? If so, you’re not alone — but don’t worry. We’re here to help by offering up a variety of Excel tricks that you can use to change the way you work and make your life a lot easier. If you’re looking for ways to get more out of your work in Excel, keep reading.
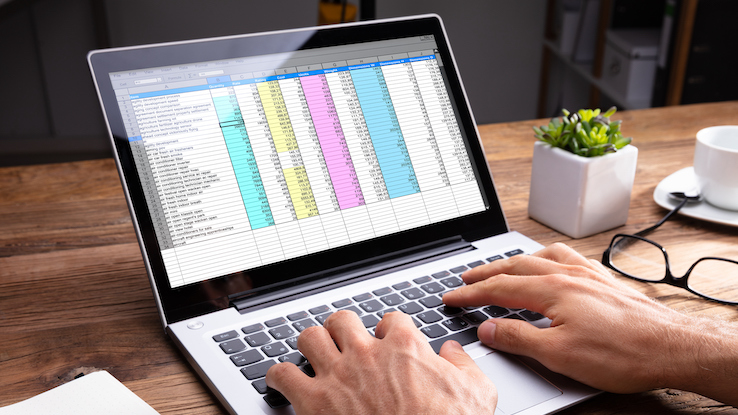
Learn How to Use Excel to Manage and Organize Your Data More Effectively
There are a few different ways you can use Excel to manage and organize your data. First, you can use Excel to create charts and graphs to help you understand your data more easily. This can help you make better decisions and better understand your data. Additionally, Excel can help you speed up your work by automating simple tasks. You can use templates in Excel to save time on your projects.
Use Charts to Manage Data Thoroughly
Charting your data can help you understand it better. Excel provides a wide range of chart types that can help you depict and arrange the different aspects of your data. You can use charts to display data in a variety of ways, including:
- Charts that show how various groups of data are related
- Charts that show changes over time in data
- Charts that display trends over time
- Charts that show how two or more sets of the same type of data compare
There are numerous chart types that you can use to visualize your data in different ways. By using Excel charts and graphs, you can make better decisions about your projects and data.
For example, let’s say you’re trying to figure out why sales are down at your business. You could use a graph to display sales data over time and see whether there are any patterns that you hadn’t noticed before. Maybe there’s a seasonal trend that you didn’t account for, or maybe there’s a problem with your product line that needs to be addressed. By using charts and graphs, you can investigate the data more thoroughly and take action as necessary.
In addition to helping you understand your data, charting can also help you communicate your findings to others. For example, if you’re a salesperson, charting your data can help you show prospective clients how your product is performing over time. This way, they have a better idea of what they’re investing in.
Charts and graphs aren’t limited to business purposes, either. You can use them to track your progress during workouts or to monitor your grades in school.
Using charts and graphs in Excel isn’t difficult – in fact, most charts and graphs can be created with just a few simple commands. So don’t be afraid to try out some of the more advanced charting techniques in Excel. They may just surprise you with the insights they reveal about your data. By using these Excel ideas, you’ll be able to work faster and more efficiently, manage your data more effectively, create charts and graphs to better understand your data, and save time on your projects.
This text was generated using a large language model, and select text has been reviewed and moderated for purposes such as readability.